


Prior to Relativity 7.5, identifying the root cause of an infrastructure problem in your environment could be a bit of a search-and-destroy mission. Infrastructure managers could comb through event logs and performance metrics for each server, but sometimes the problem might still be a mystery.
When an infrastructure problem interferes with user experience, it can jeopardize important deadlines. We’ve seen our users tackle these tough problems on their own, using specialized tools to monitor hardware usage and identify issues. In an effort to simplify these users’ day-to-day tasks, we sought to build an application in 7.5 tailored specifically to infrastructure managers.
In practice, infrastructure managers use Relativity Performance Dashboard on a daily basis to check in on environment and system health. To get a feel for Performance Dashboard in action, picture yourself maintaining a Relativity infrastructure on a Friday afternoon. Your users are hammering away at their work, trying to get projects finished before the weekend, when suddenly everyone is getting kicked out of Relativity. You are deluged by calls and emails from the team.
Logging into Relativity, you quickly navigate to the Performance Dashboard tab in admin mode. In the Server Health section, you select all servers, and run through the list of metrics that Performance Dashboard has automatically calculated for you. One chart reveals high CPU activity—peaking at 100 percent—on the SQL server. The chart for page life expectancy shows that it also tanked around the same time. Based on this information, you suspect that a user's long-running search or searches has caused the timeouts.
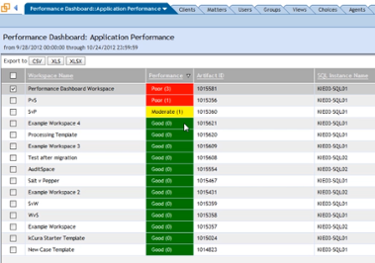
In the Workspace Health tab, you can access a list of all the workspaces and see the total long-running search counts for each one. Flagged by a red cell in the Performance column, you identify one workspace that’s had a number of long-running searches today. You access the History tab of the workspace in question, and identify a single user who has repeatedly submitted those complex searching.
You now know that tuning the problematic search or discussing a better approach with the user may help to mitigate the timeout problem and prevent recurrences. Your environment can run smoothly again. Problem solved.
Based on the information you’ve gathered through Performance Dashboard, the goal is that you could now prevent the problem from repeating itself in two ways: improve all your end users’ understanding of searching best practices, or purchase more memory for your SQL server. After all, your environment is growing, and you can't stuff ten pounds of potato chips into a five pound bag. Performance Dashboard requires little to no configuration, and can communicate with all Relativity servers. With it, you can quickly identify problem areas and scale as needed. Additionally, by observing trending data, you can anticipate issues and scale preemptively.
Our team is making continuous improvements to the application, and we’re happy to hear your suggestions and feedback.


